Modelling
Six years ago I saw BIM as a technology, another program like Revit, Archicad and Microstation, or merely a piece of software to be learned, implemented and harvested. While in essence this is still true, my focus has changed dramatically where today it is a process, a method of sharing data and a controller of risk and certainty. Initially it was seen by many as a procurement modeller (fig. 1), but now it is becoming the client's financial model, the design team's construction model and the owner's facilities management model, all bound inextricably together into a BIM pipe.
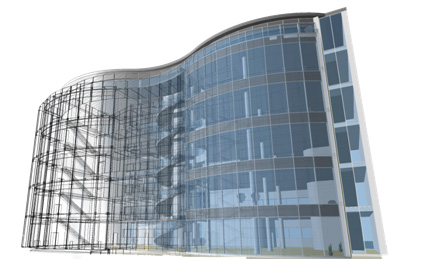
Figure 1 Commercial Office, Western Harbour One.
©James Harty 2011
While previously they were three parallel systems, which at best glimpsed at each other across a board room table and at worst never fell into enemy hands, now there is a new culture growing, where how we can best use our models, reuse them and finally share them is to the fore. This is being adopted and propagated to deliver projects on time and to budget which are sustainable and accountably so.
A model is an incredible concept - a representation of a perception or a performance which can be paraded and tested before implementation. Fashion designers use a model to show off their designs, to mould the minds of the consumer to the next seasons offerings and to build prestige. Scientists on the other hand use models to limit their scope, to test their findings and to resolve problems. Both have huge validity, whether it is through authorship or analysis.
In construction and architecture it is the blueprint for the building, the embodiment of the design and the contractual currency for execution. It is the planning; the drawings, the specification, the quantities and the scheduling required to make a building a reality. But it's more. With digitalisation a whole new world of opportunity has opened.
The financial model
The decision to build usually involves a financial institution or at least a financial plan. What is it going to cost, what is the budget and how is it going to be paid all come into the mix. To appraise these issues a notional building is addressed where occupancy, function, location and their impact is assessed on a spread sheet, where the building's form is not part of the equation, at least not until the money is approved. The people making these decisions are usually not spatial or graphical in their prowess and any hint of form is unwelcome and ill-advised.
But adjacency and interaction can be an important part of this process and this is often represented in a bubble diagram (fig. 2), for want of a better word. Large bubbles represent large spaces and often are accompanied by notional areas or numbers of occupancy, and these can be overlapping or connected by lines.
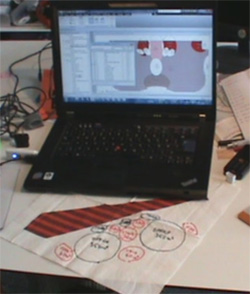
Figure 2 Napkin to Laptop.
©James Harty 2011
As described this work is separate from and lies outside any usable model for further work. But now it can be done within a modelling program such as Revit which can drive the process right through to procurement. Placing a massing element on the site with the desired height, or placing a parametric volume which maintains the square metres floor area (fig. 3), room separators can be used to generate circles and ellipses (essentially free forms). This process happens without defining rectangular areas which can often be misread as definitive spaces so that the abstract nature of the forms can be maintained. Tags are now added, which are as simple as name and size, so that schedules of accommodation are instantly available (fig. 4). When the correct mix is found, price books can be associated with the data and budgetary figures are determined.
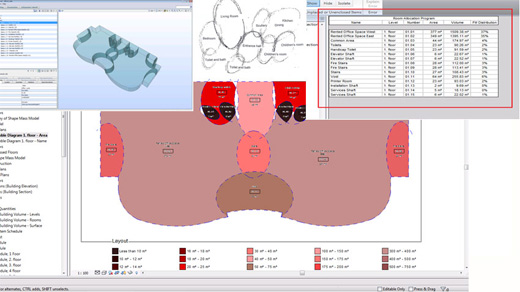
Figure 3 Developed schematics.
©James Harty 2011
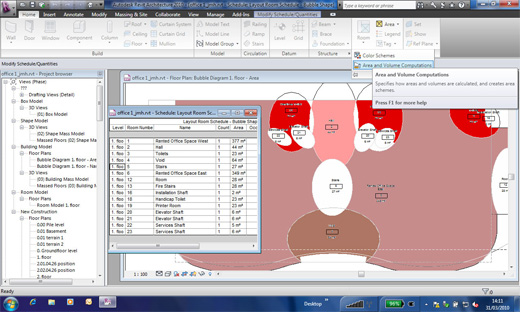
Figure 4 Tagging allows area take-offs.
©James Harty 2011
This work is phased within the model as preconstruction work. This means that it can co-exist within the model proper when construction work is subsequently prepared. The benefit of having it here is that specific climatic data can be added to this conceptual form and feedback given, regarding shape, orientation, shading, heat gain, exposure (fig. 5) and energy performance (fig. 6). A report can be generated containing all the above data and if several forms are tested, several reports can be generated and cross referenced in a compare and contrast fashion, giving informed comment.
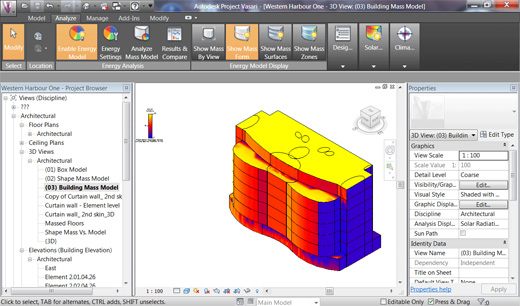
Figure 5 Options can be analysed and documented
©James Harty 2011
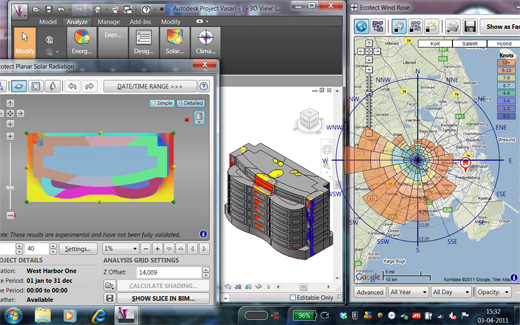
Figure 6 Climatic data can inform the design even at this early stage
©James Harty 2011
The design model
Armed with this data the next phase of procurement is better prepared. I know some would say that this is tangential to my design methods or that this cannot, or will not affect my design process, but it can inform it. Designing for large corporate clients often means devouring volumes of standards, branding and methods that the corporation has developed so that a corporate image is presented or that certain prestige is conveyed, which during the Appraisal and Design brief (A & B) can be very time consuming.
As the design progresses the early work is not lost and as each form becomes an entity the early data is kept and updated and reports can affirm compliance with the initially agreed proposal. For the client this gives a greater amount of certainty to the project which can be lost in traditional procurement methods. As the project goes through Concept, Design Development and Technical Design (C, D & E) these can be saved into phases in the model and through filtering of the views in the model, targeted drawings can be formatted to targeted audiences.
Typically this might mean showing existing, demolition and new proposals tailored to whom the drawings are intended. This means the client gets colour coded legends, the planners code compliant sets of drawings and the contractor location, component and assembly drawings along with the schedules, quantities and specifications, all generated from the model.
Whether the output is paper format (drawings) or filtered sets (views) from the model raises a new situation, the sharing of information. The former is of no interest here as it has caused no end of checking, cross checking, red lining and revisions that eats away the fee and demoralises design teams. But how is the exchange of information handled? Who owns it, who manages it and who is responsible for it regarding errors, omissions and corrections.
If the architect makes a generic wall of 450mm width, does the contractor sue or request further information when it transpires that it has to be 520mm consisting of brick, insulation and load bearing reinforced concrete later in the design? Who is responsible for detailing the design, who is getting paid for it, or when does it come into the model following the phased work stages?
Architects or those who generally start the project mean their model is a chargeable extra. Contractors or those who take over the project feel it should be free or at no charge as it is part and parcel of the procurement. Initially the call was to give it away as it would come back in spades, but this clearly has not happened.
Under Design and Build or Partnering contracts this is abated by having all involved under the same umbrella, but even here when the work goes further down the supply chain, vested interests find it very difficult to give away trade secrets or bespoke expertise to erstwhile competitors outside of this contract. So the new benchmark that the construction sector must address is collaboration, with whom and how.
Essential to collaboration is the first line of the contract, that signees will not sue each other. While sounding innocent this is a major step. Methods have to be found to remunerate work at a fair rate. Competences need to be appraised and rewarded appropriately. Changes and error rectification needs to be awarded to who is best placed to do the work. There has to be an incentive to complete on time and to budget. There has to be mutual respect for all in the supply chain, and this is called plain and simply, trust.
This in turn is seeing the phenomenon of Capability Maturity Matrices (CMMs) appearing, where differing parties tabulate their competences, their bond values and their ambitions or experience, and others compare and contrast it with their own, so that strategic alliances can be formed. This is not unlike speed-dating, and the metaphor does not end there. These collaborations are not for a single project but are related to the longer term. If a team comes together and competes and completes on a hospital (say), then they will try and corner that market and capture all related work.
Comparisons can be seen in large legal firms for architects, and also in major contractor/developer firms and large consulting engineers who feel they have the momentum to carry this off. But there is room for small players too and smaller targets but this is ongoing. When it filters all the way down to sub-contractors who can take off quantities from the model then significant progress has been made.
Typically these consortia comprise a design team (architect, structural and service engineer) who use or plug into the same model. From this a surveyor or estimator can extract quantities from the model and together with a price book or work rates and material costs can price the work. Moreover once each component is type coded it has a classification which can be linked to specifications clauses to generate full building part specifications. Following this, a contractor or project manager can begin sequencing the work so that there is control on site with proper manning and resources.
During procurement, packages can be taken off so that sub-contractors can find out how much piping, cabling or materials need to go into the van every Monday, where it is destined for, and how much time and how much money are allocated. This does not require the sub-contractor to have expensive authoring software (like Revit) but to only have a reader (Navisworks Freedom, Tekla Viewer or Solibri) not unlike Adobe Acrobat Reader which is free to the user, meaning they can open the file and interrogate it. This is also indispensible to the project manager in accessing the data.
If a project is authored in Revit or similar, through a process of tagging data, type codes, can be allocated (fig. 7). Using quantity extraction programmes (Code Group - Sigma) a classification system can be selected and applied (fig. 10). This can be CAWS, Omni-class or any internal in-house system. The tagging of elements in the Revit model when complete (fig. 8-10), can be exported to Sigma where all the entities can be updated against a price book such as SPONS (fig. 14). This gives a priced bill of quantities which can be linked back to the model so that any changes are updated in both places.
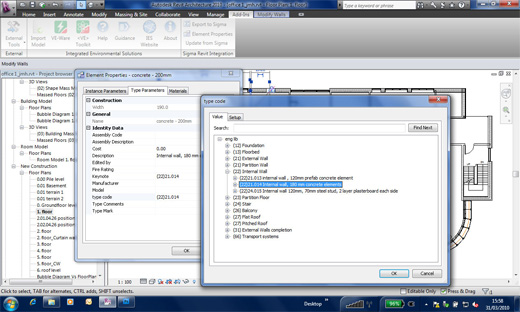
Figure 7 The 3D model can be exported to 4D and 5D programmes which can be imported to model viewers
©James Harty 2011
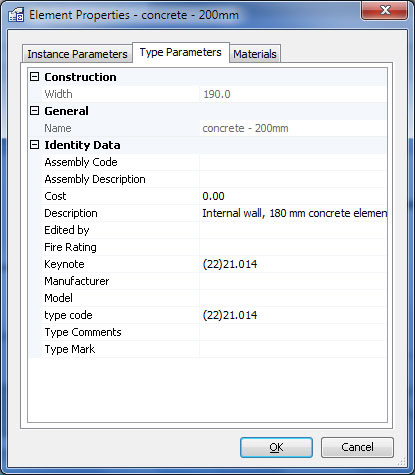
Figure 8 Type codes drive the integration
©James Harty 2011
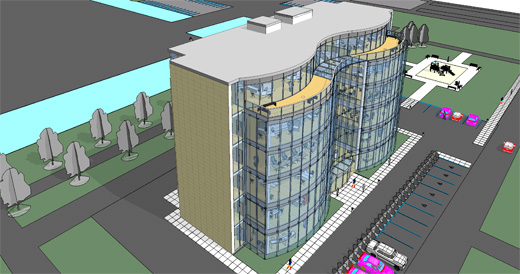
Figure 9 Finished model
©James Harty 2011

Figure 10 Interior view
©James Harty 2011
After this process the quantities can be exported to a Gantt chart program (MS Project) where all the resources come in with the current day's date (fig. 11). A Gantt chart allows these entities to be placed either through critical path of sequentially so that a start date and practical completion date can be calculated (fig. 12). Currently this is not bidirectional with the previous work. An added chart column sequences the construction time line. Armed with the Revit model (3D) the Project chart (4D) and the Sigma schedules (5D) these three models can be imported into Navisworks (or Tekla and Solibri). This is done by exporting the 3D model from Revit and linking it from within Navisworks to the resources and time. A time line feature (fig. 13) will sequence the work in a movie or the project manager can move the sliding time line bar to see the progress of the work. Selecting an element brings up when it will be built and other data like delivery and storage can be accessed or noted here.
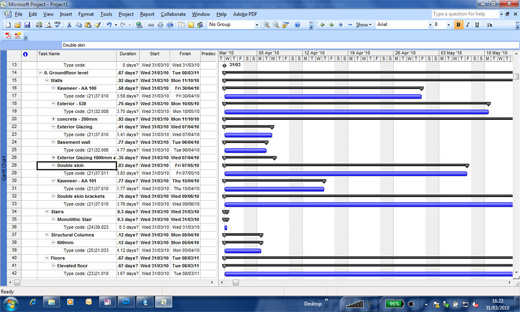
Figure 11 The quantities can be exported to MS Project
©James Harty 2011
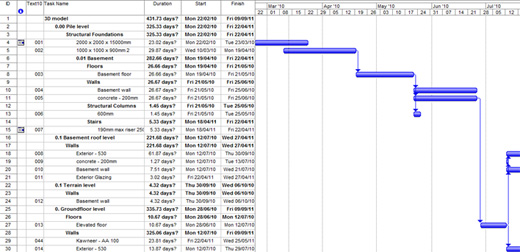
Figure 12 Sequencing can now be added
©James Harty 2011
Figure 13 Production time line can now be generated
©James Harty 2011
The added benefit here is that the slider bar can be moved to today's date and the expected work can compared to the actual work, meaning the manager can see if the work is ahead of schedule or behind. Navisworks will also allow him to make clash detections which can be implemented earlier in the process eliminating many architect's instructions and requests for information on site.
The facilities management model
If the above has been carried out as described then the final virtual model should be a replica of the actual building. This is of significant relevance to the owner or whoever is responsible for running the facility. Previously the Facilities Manager started from scratch building a maintenance model, because often what was handed over bore no relationship to what was initially proposed.
Within the model each element has a right click properties dialogue box built up of parameters and values. Simply said, a place holder is identified and a value entered, so that the 'height of a door' might have the value of '2100 mm'. During the early work stages of the project it is of no relevance to the architect who the manufacturer is, but at some point in the process it will become relevant, typically when the contractor is placing an order. If the contractor uses the model to enter the supplier, then other data can be added such as durability, colour, model number as well as all ironmongery and key identification numbering. Or if it is not done then that the ability is there for later or whenever appropriate. This is the beauty of a centralised point of contact.
Although not implemented at time of writing, there is research saying that once a door is placed in a model, that it should be possible to elicit information about it for later use. Just as smart phones use apps (applications) to do things, bots (robots) are waiting to do other things. Search engines are very well advanced today. Enter a word or topic in your browser search engine and a meaningful response is returned based on others who made the same search and relevant to you location. All this happens in the background and without going into the algorithms, we all use it and are relatively pleased with the hit rate and response. That's why we come back.
Imagine a bot placed on a door going off quietly and finding all the doors that meet the requirements demanded for that door. Initially it might only be an internal single leaf door, with twenty three manufacturers that fit the bill, but by the time it is fully commissioned it might have a gained fire rating, sub master key with particular hinges, a particular type of wooden veneer, a specific model and price, with a specified life expectancy with inbuilt inspection periods or repair schedules. This data is only relevant to those who need it but at each stage of the process there is finger tip informed data at the ready awaiting selection.
All in all there are fascinating developments happening, and they are happening at a rate of knots. Patrick MacLeamy has engaged us with his 'BIM, BAM, BOOM' scenario where for every dollar spent in the design phase, there are $20 spent in the assembly or construction, which leads to $60 in its operation and maintenance. If clients and users are not demanding this consideration in their projects then we are falling them. If we are not looking at sustainable issues through all phases, then we are falling ourselves.
Finally I would like to thank my students, Mike Coombe, Peter Erler and Sean Termansen, for their help in developing this model (fig. 14) and whose work has been used to demonstrate its application at the Copenhagen School of Design & Technology.
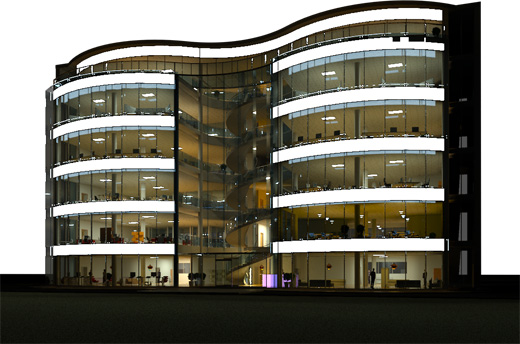
Figure 14 Rendering showing lighting
©James Harty 2011
About this article
This article is also available as a .pdf document ![]() (1.12 MB).
(1.12 MB).